
|
Mrs. Claire Campbell's first grade class visited the computer lab and graphed data showing what means of transportation they use to get to school. Our friends in Japan responded and showed us their graph. Can you guess how they travel to school?
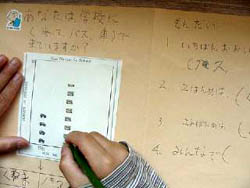
Tomo works with our graph... and asks some questions.
|
||||
| More | ||||
|
|
||||
Math presentation prepared by Joyce Perdue and
Patti Weeg
for the National Title 1 Conference - Tampa, Florida: January 24-26, 2002
| Authors in Residence |
Elementary Math Students in the CyberZone |
www.globalclassroom.org
January 2002