Graphing and Interpreting Data - Grade 3 |
|
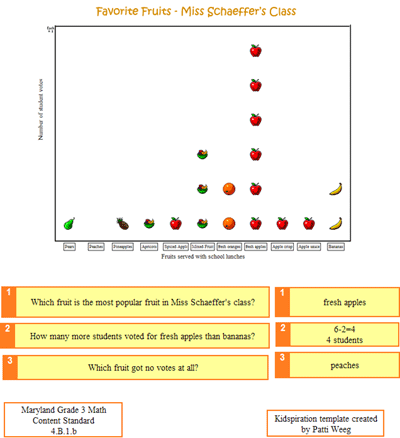
 Mrs. Weeg's computer lab students took a survey of favorite fruits in school lunches served at Delmar. They made graphs in Graph Club software. Then they answered questions about the graphs to analyze and interpret their data in the Kidspiration activity above. |
|
back
|