Delmar Graphs
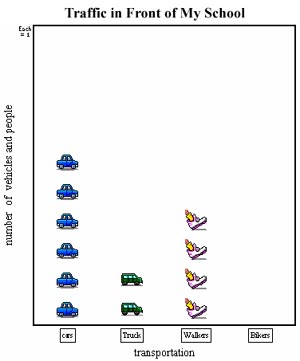 |
Dear friend in Japan,
I saw your graph that shows how many vehicles and people passed by your schoool. I predicted that if I counted the vehicles and who passed by my school that the number would be less.
I counted the cars, trucks, walkers and bikers that passed by my school from 8:30-9:00 AM on Monday, October 6. My prediction was correct. My graph shows you the data.
Cars = 6
Truck = 2
Walkers = 4
Bikers =0
When I look at my graph and compare it to your graph I think that your school might be located at a city. My school is located near fields and farms.
Your friend,
Darian
|
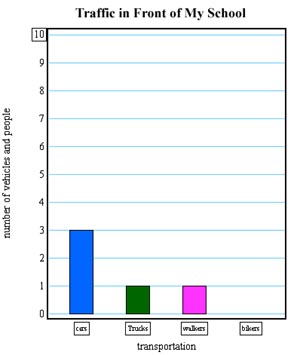 |
Dear friends in Japan,
I saw your graph that shows how many vehicles and people passed by your school. I predicted that if I counted the vehicles and people who passed by my school that the number would be the most at dismissal time and at the beginning of school.
I counted the cars, trucks, walkers, and bikers that passed by my school at 9:00 on Monday, October 6. My prediction was our number would be smaller than yours. My graph shows you the data. I was right.
Cars 3
Trucks 1
Walkers 1
Bikers 0
When I look at my graph and compare it to your graph I think that your school might be located on a highway. My school located in a neighborhood.
Your friend,
Amber
|
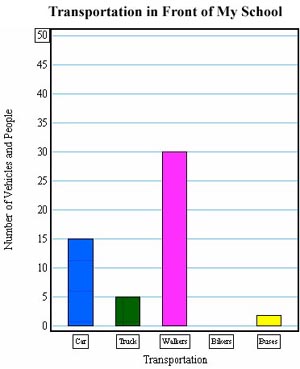 |
Dear friends in Japan,
I saw your graph that shows how many vehicles and people passed by your school. I predicted that if I counted the vehicles and people who passed by my school that the number would be less. I counted the cars, trucks, walkers and bikers that passed by my school at 11:50 on Monday, October 6. My prediction was we would have less. My graph shows you the data.
Cars 15
Trucks 5
Walkers 30
Bikers 0
When I look at my graph and compare it to your graph I think that your school might be located by a highway. My school is located in a neighborhood.
Your friend,
Gerrod
|
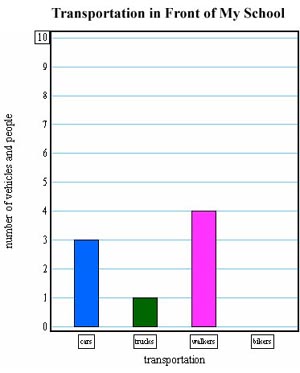 |
Hi Friends in Japan,
I saw your graph that shows how many vehicles and people passed by your school. I predicted that if I counted the vehicles and people who passed by my school that the number would be less.
I counted the cars, trucks, walkers and bikers that passed by my school at 12:45 pm on Monday, October 6, 2003. My prediction was right. My graph shows you the data.
Cars = 3
Trucks = 1
Walkers = 4
Bikers = 0
When I look at my graph and compare it to your graph I think that your school might be located in the city. My school is located in a neighborhood.
Your friend,
Devene
|
|