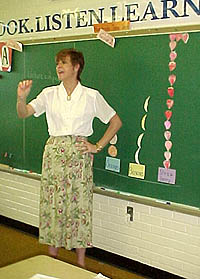
 Mrs. West's first grade math class visited the Write Place computer lab and graphed data they collected in their classroom about their favorite fruits.
 Before they came to the computer lab they made a graph on the blackboard in the classroom. Each student cut out a colored piece of fruit representing their own favorite fruit. They taped the fruit pieces in the form of a graph on the blackboard. The students took the data they saw on the blackboard and made a data table on paper. After the students made their data table they went to the computer lab where they made their graphs using Graph Club software. Each student placed the correct number of fruit in each color of a pictograph and bar graph. They labeled the axes and gave titles to their graphs. Each student left the lab with a printed copy of his or her graphs. Below are two sample graphs made by Travis using "Graph Club":
|
|
| home | greetings | new | kids | teachers | visitors | resources |
|
||
|
