Hello friends,
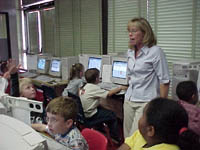
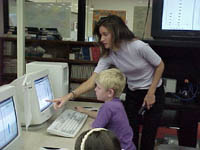
 Would you like to share data with us and make some graphs? We would like to work with you. Mrs. Claire Campbell's first grade class visited the Write Place computer lab and graphed data showing what means of transportation they use to get to school. They also graphed their favorite sports. How do you and your classmates get to school each day? What are your favorite sports? In the pictures you can see Mrs. Campbell and Miss Hiller helping the students.
The students did an excellent job making graphs using Graph Club software. They had absolutely no problems changing the default symbols in the graphs from pets to pictures of transportation and sports. What super computer users they are! We are so proud of them!
As you look at Mrs. Campbell's students' graphs see if you can answer these questions:
- How many students participated in each survey in Mrs. Campbell's first grade class?
- How do most of the students in her class go to school?
- Which sports are liked by the same number of students?
- What is the favorite sport in Mrs. Campbell's class?
- How many more students ride the bus to school than come by car?
Friends in Japan reply! -
Tomo works with our graph
From Botswana!
Our friends in Botswana (Std 4 at Kgaswe) made graphs of their favorite fruits. Click on the graph to see a larger version of the favorite fruits of grade 1H. Thank you, Std 4 and 1H!
How We Get To School
 |
How We Get To School
 |
Our Favorite Sports
 |
Our Favorite Sports
 |